
Steam power
Rankine cycle, water properties, component efficiencies, boiler-pressure study.
THERMODYNAMICS & CYCLE ANALYSIS
Build and refine cycle models in an engineering equation editor. Connect fluid properties, solved states, and process paths, then follow a design change through to performance.
01 / CONNECT THE STATES
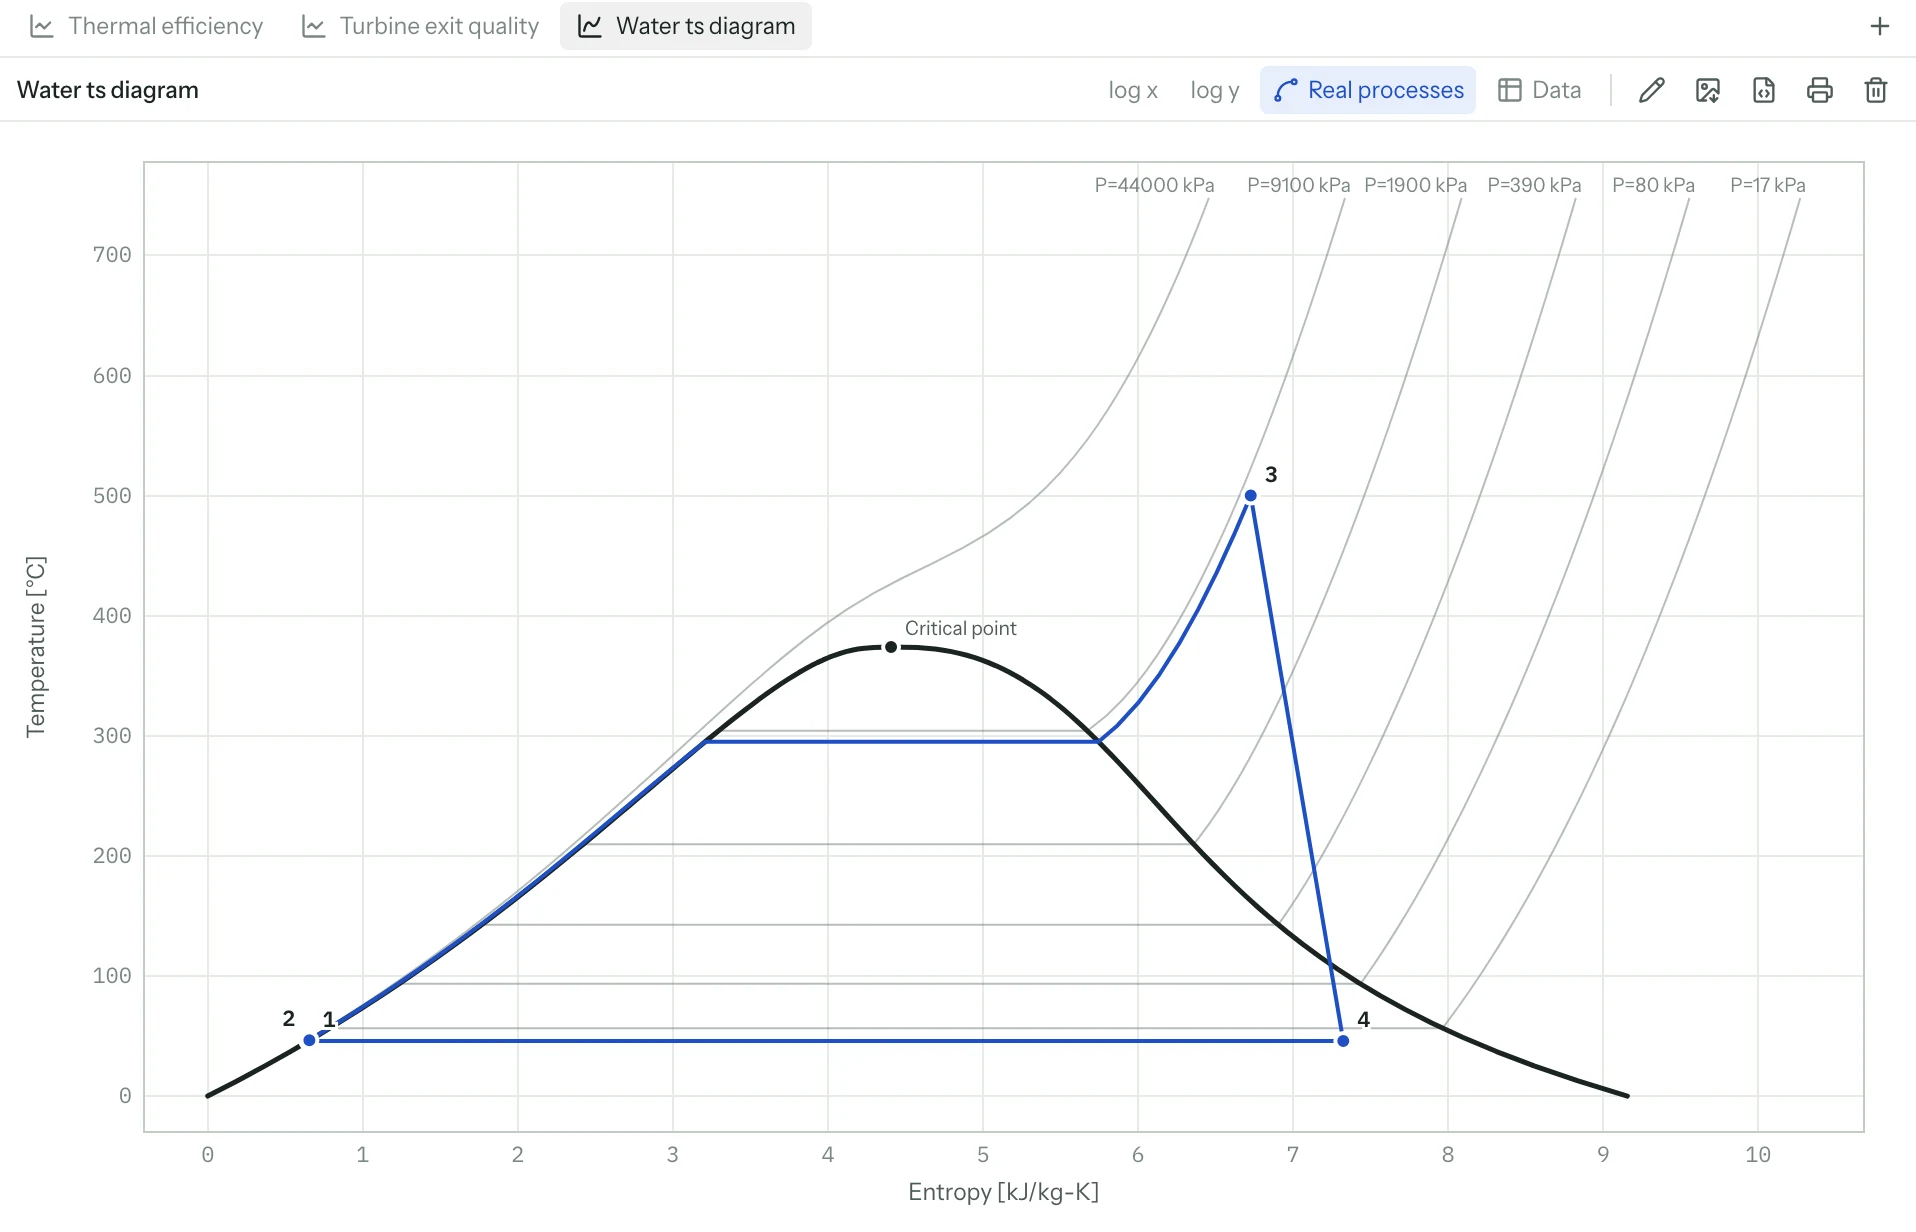
Build the cycle with the agent, then inspect the solved states. Change a pressure, temperature, or efficiency and follow its effect through the table and property diagram.
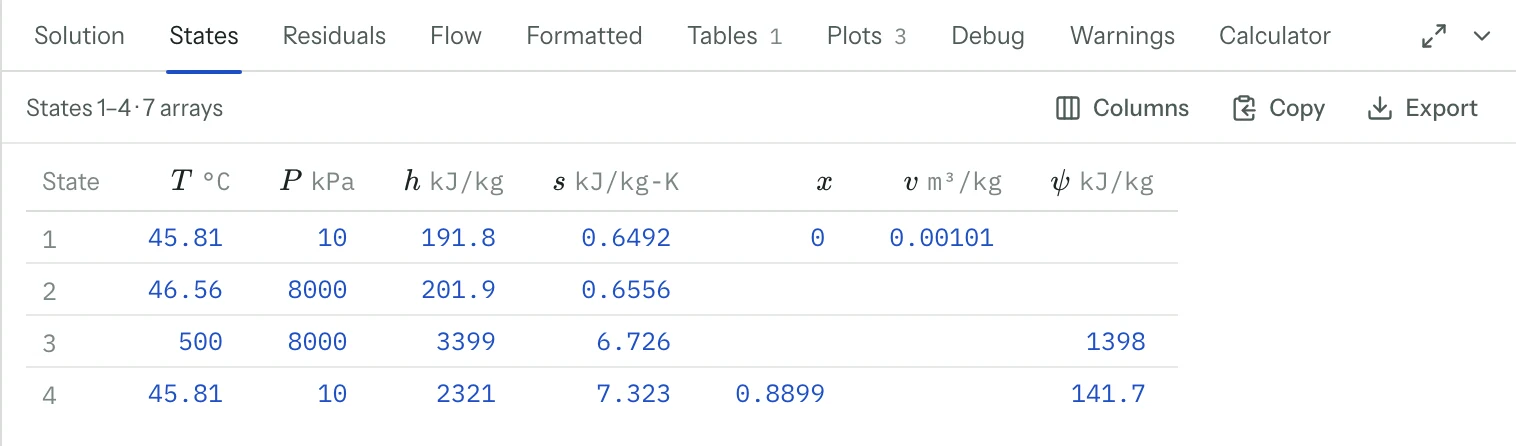
Inspect enthalpy, entropy, density, and transport properties at each state. Autocomplete adapts the available property inputs to the selected fluid. The property-call builder lets you evaluate a call before inserting it into the model.
T–s, P–h, P–v, T–v, h–s, and psychrometric diagrams connect solved states. Recognized constant-property processes follow their paths through the diagram.
02 / COMPARE THE DESIGNS
Pin net power and efficiency, then drag a pressure input to see how both respond. Quick sweep plots the response across a range without setting up a table. A sensitivity chart helps you decide which inputs deserve a closer study.
Use Min/Max to search within bounds, and uncertainty propagation to see how input uncertainty reaches an output. Keep energy-balance checks visible with model assertions.
Plan a design comparison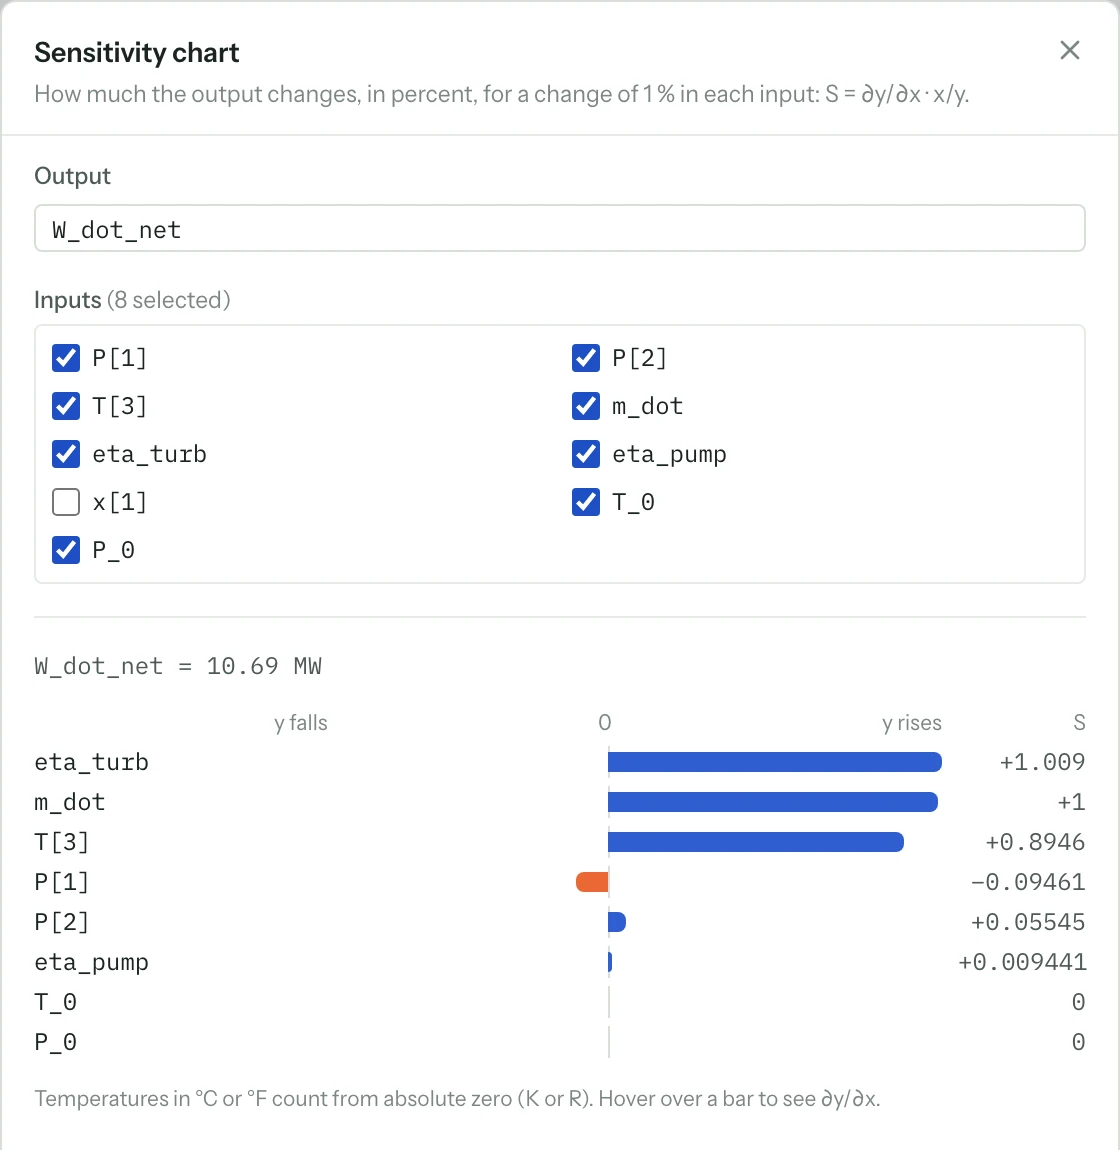
03 / SHARE THE REASONING
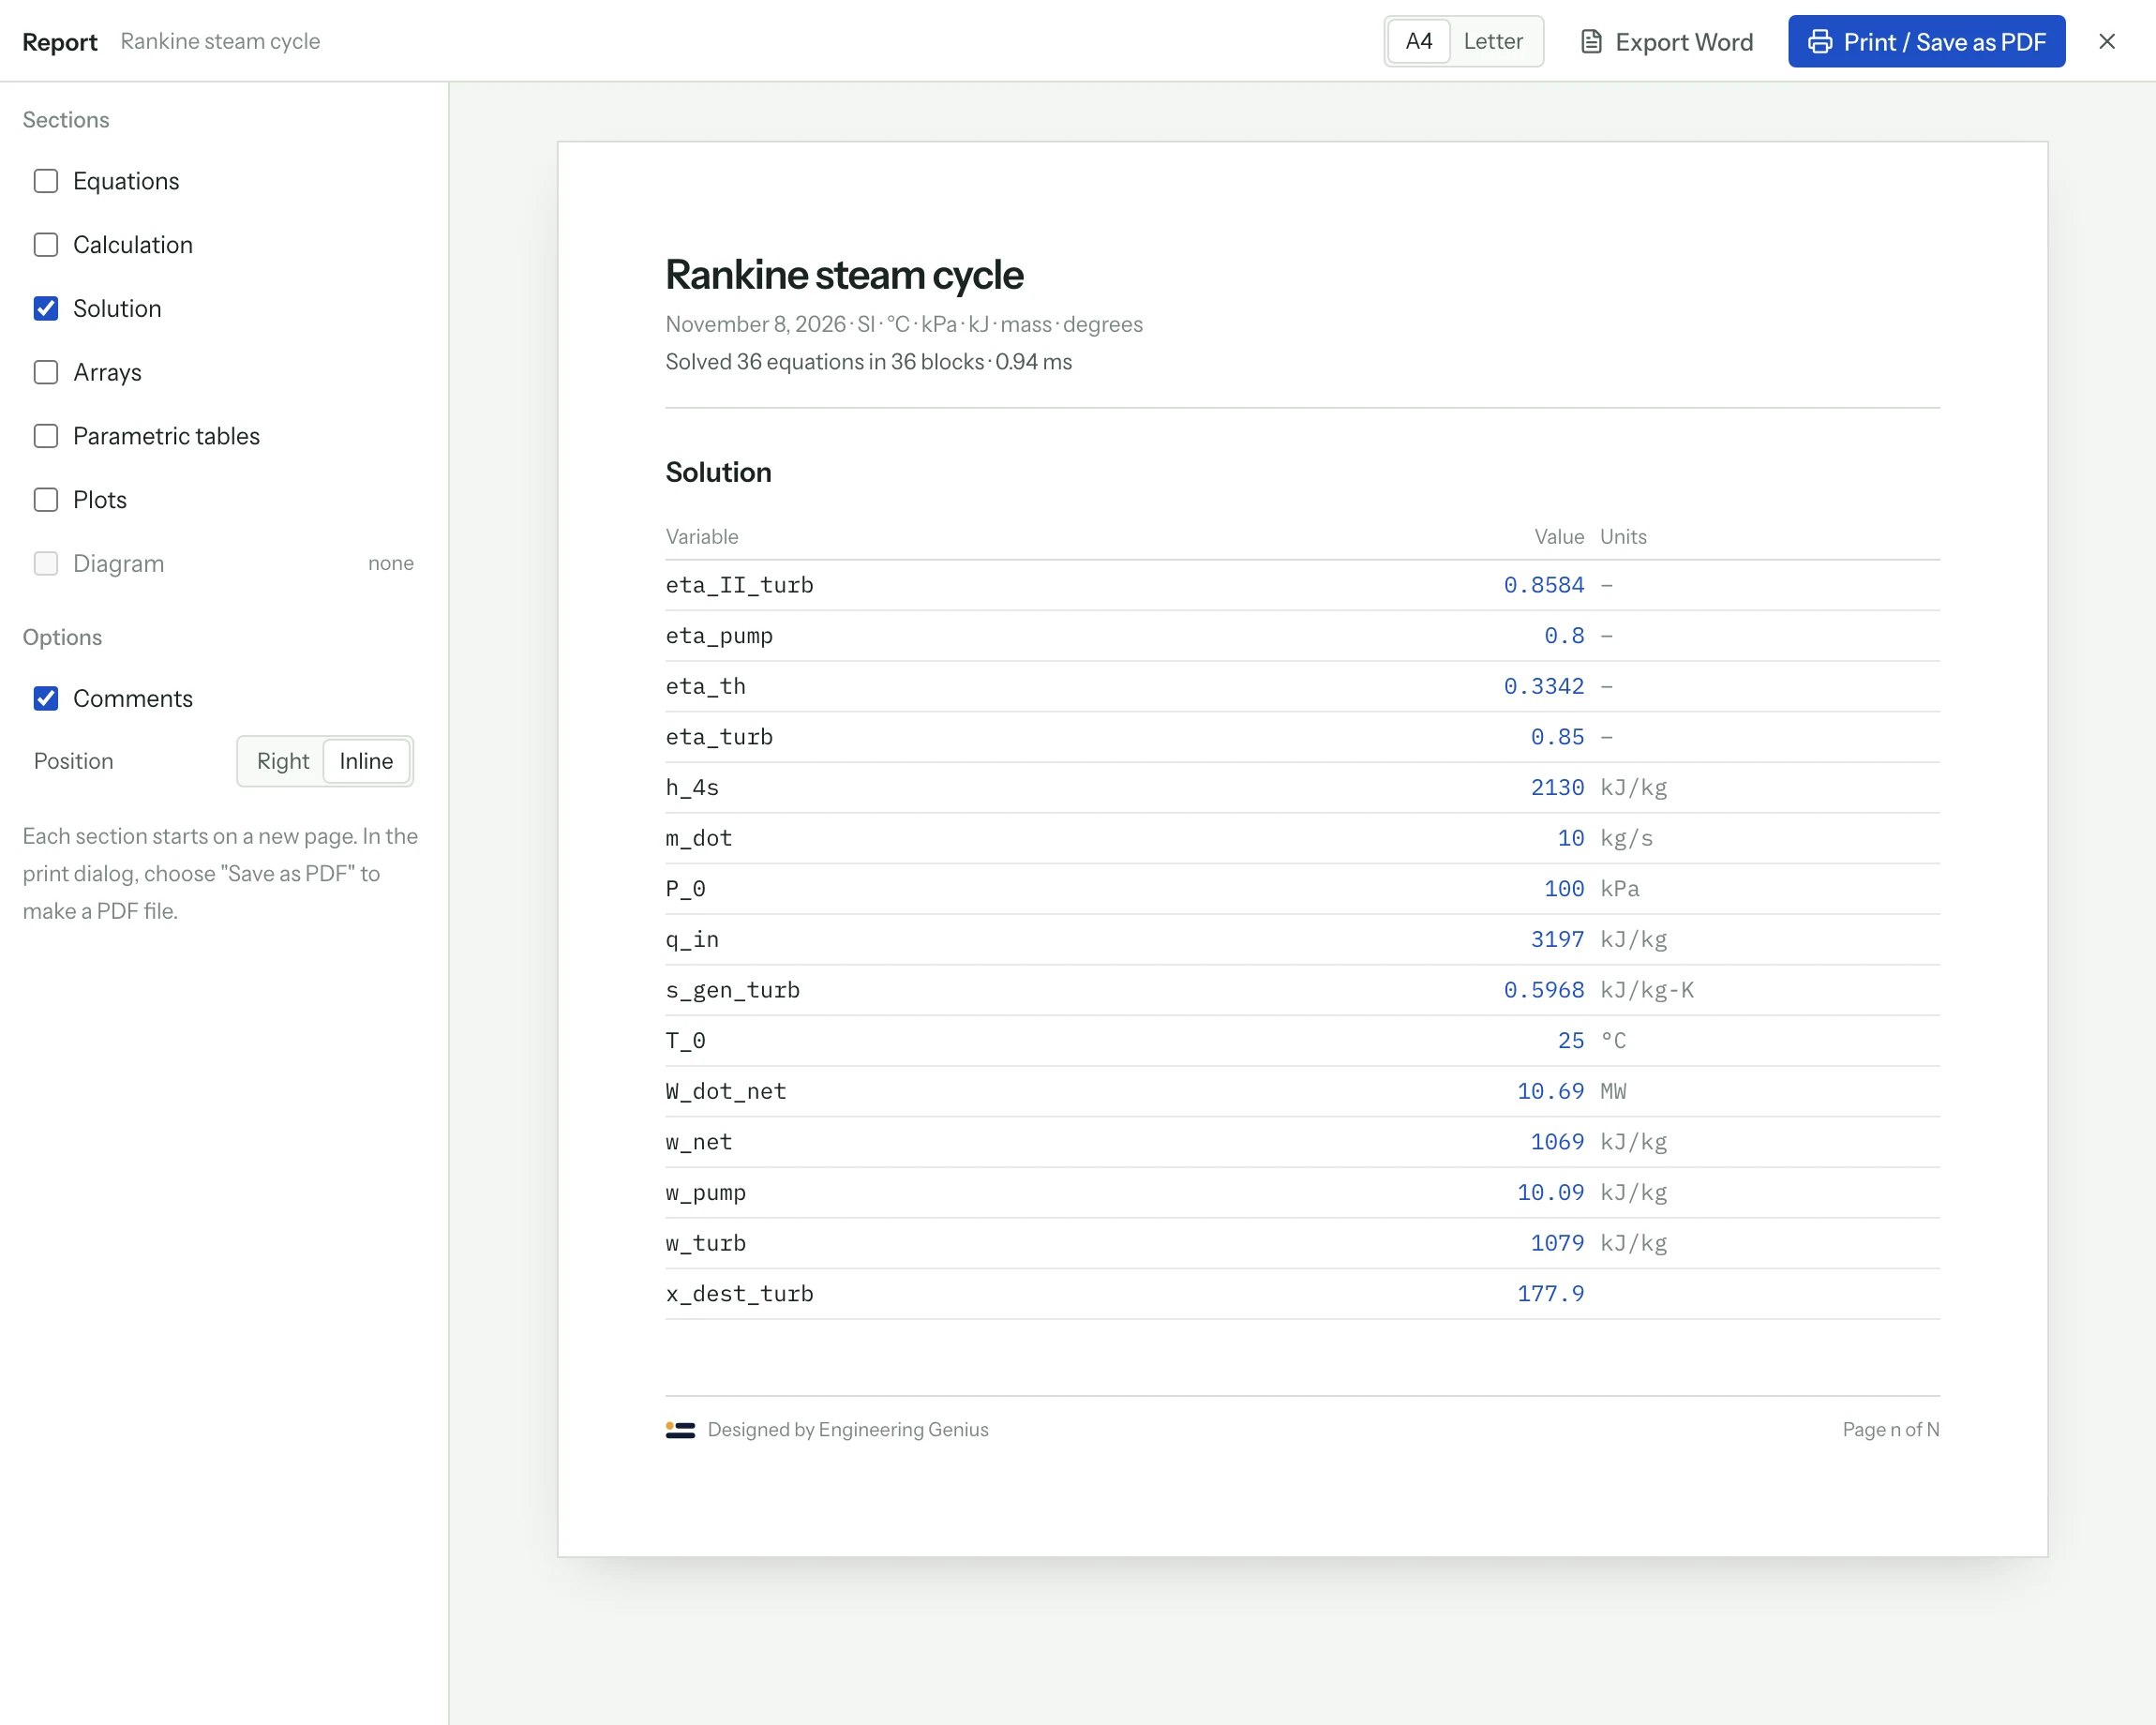
Carry the equations, substituted values, state tables, and plots into a calculation report. Or put inputs and outputs on a diagram and publish a calculation app.
FROM A SOLVE TO A HANDOFF
Formatted calculations show the symbolic relationship, the values and units substituted into it, and the result.
A published calculation app gives colleagues a way to change inputs and solve in a browser.
Explore reports and sharingCHOOSE A STARTING POINT
Rankine cycle, water properties, component efficiencies, boiler-pressure study.
Vapor-compression model, refrigerant properties, and P–h process paths.
Air-standard Brayton cycle with compressor and turbine efficiencies.
Cooling and dehumidification, condensate, and cooling load.
Built-in examples open as editable copies. Property coverage includes real fluids, refrigerant blends, ideal gases, moist air, and brines; review the ranges and reference states for your model.
FROM A QUESTION TO A WORKING MODEL
Describe the problem, review the model, and explore the alternatives.